Logstash - 用法详解和配置示例
目录
一、Logstash架构介绍
Logstash的基础架构类型pipeline流水线,如下图所示:


● Input,数据采集(常用插件: stdin、 file、 kafka、 beat. http、 )
● Filter :数据解析/转换(r常用插件: grok、date、 geoip、 mutate、 useragent )
● Output :数据输出(常用插件: Elasticsearch、 )
二、Logstash 配置示例
# 1.读取json文件
input {
    file {
        # 必选项,配置文件路径,可定义多个,也可模糊匹配;
        path => "/home/ldy/logstash/bs_domain/*.json"
        # path => ["name1.json","name2.json", "name3.json"]

        # 选择logstash开始读取文件的位置,begining或者end
        start_position => "beginning"

        # 设置编码
        codec => json { charset => "UTF-8" }

        # 可选项,Logstash多久检查一下path下有新文件,默认15s;
        #discover_interval => 15

        # 可选项,logstash多久检查一次被监听文件的变化,默认1s;
        #stat_interval => 1

        # 可选项,记录文件以及文件读取信息位置的数据文件;
        #sincedb_path => "/home/ldy/logstash/bs_domain/.sincedb"

        # 可选项,logstash多久写一次sincedb文件,默认15s;
        #sincedb_write_interval => 15

        #mode => "read"
        #file_completed_action => "log"
        #file_completed_log_path => "/var/log/logstash/bs_domain/file.log"
    }
}

# 2.过滤格式化数据阶段
filter {
    mutate {
        # 删除无效的字段
        remove_field => ["_id", "host", "path", "@version", "@timestamp"]
    }
    # 新增timestamp字段,将@timestamp时间增加8小时
    # ruby {code => "event.set('timestamp', event.get('@timestamp').time.localtime + 8*60*60)"}

}

# 3.数据输出到ES阶段
output {
    stdout {
        codec => rubydebug
    }
    elasticsearch {
        hosts => ["127.0.0.1:9200"]
        # user => "username"
        # password => "123456"
        document_id => "%{name}"  # 用json的name字段代替es记录的_id
        index => "bs_domain"
    }
}
三、Logstash Input插件
input插件用于指定输入源,一个pipeline 可以有多个input插件,我们主要围绕下面几个input进行介绍:●stdin●file●beat●kafka
实战1 :从标准输入读取数据,从标准输出中输出内容:
#环境测试
[root@logstash-node1 logstash]# cd /etc/logstash/conf.d/
[root@logstash-node1 conf.d]# vim input_file_output_console.conf
[root@logstash-node1 conf.d]# cat input_file_output_console.conf
input {
    file {
        path => "/var/log/oldxu.log"
        type => syslog
        exclude => "*.gz"               # 不想监听的文件规则,基于glob匹配语法
        start_position => "beginning"   # 第一次丛头开始读取文件 beginning or end
        stat_interval => "3"            # 定时检查文件是否更新,默认1s
    }
}

output {
    stdout {
        codec => rubydebug
    }
}
[root@logstash-node1 conf.d]# /usr/share/logstash/bin/logstash -f input_file_output_console.conf

[root@logstash-node1 conf.d]# vim input_stdin_output_console.conf
[root@logstash-node1 conf.d]# cat input_stdin_output_console.conf
input {
    stdin {
        type => stdin
        tags => "tags_stdin"
    }

}

output {
    stdout {
        codec => "rubydebug"
    }
}

[root@logstash-node1 ~]# echo "qwwe" >/var/log/oldxu.log
[root@logstash-node1 conf.d]# /usr/share/logstash/bin/logstash -f input_file_output_console.conf
......
{
       "message" => "qwwe",
          "path" => "/var/log/oldxu.log",
    "@timestamp" => 2020-01-15T01:37:08.418Z,
          "host" => "logstash-node1",
          "type" => "syslog",
      "@version" => "1"
}
是否真正启动成功,打开 logs/skywalking-oap-server.log 日志文件,查看是否有错误日志。首次启动时,因为 SkyWalking OAP 会创建 Elasticsearch 的索引,所以会“疯狂”的打印日志。最终,我们看到如下日志,基本可以代表 SkyWalking OAP 服务启动成功: 友情提示:因为首次启动会创建 Elasticsearch 索引,所以可能会比较慢。
2020-01-02 18:22:53,635 - org.eclipse.jetty.server.Server - 444 [main] INFO [] - Started @35249ms四、Logstash Filter插件
数据从源传输到存储的过程中, Logstash 的filter过滤器能够解析各个事件,识别已命名的字段结构,并将它们转换成通用格式,以便更轻松、更快速地分析和实现商业价值。●利用Grok从非结构化数据中派生出结构●利用geoip从IP地址分析出地理坐标●利用useragent丛请求中分析操作系统、设备类型
4.1 Grok插件
1.grok是如何出现?
#我们希望将如下非结构化的数据解析成json结构化数据格式
120.27.74.166 - - [ 30/Dec/2019:11:59:18 +0800]"GET / HTTP/1.1"
302 1 54
"Mozi11a/5.0 (Macintosh; Intel Mac OS X 10 14 1) Chrome/79.0.3945.88 Safari/537.36"

#需要使用非常复杂的正则表达式
\[([^]]+)]\s\[(\W+)]\s([^:]+:\s\w+\s\w+\s[^:]+:\S+\s[^:]+:
\S+\s\S+). *\[([^]]+)]\s\[(\w+)]\s([^:]+:\s\w+\s\w+\s[^:]+:
\S+\s[^:]+: \S+\s\S+). *\[([^]]+)]\s\[(\w+)]\s([^:]+:\s\W+
\s\w+\s[^:]+:\S+\s[^:]+: \S+\s\S+).*
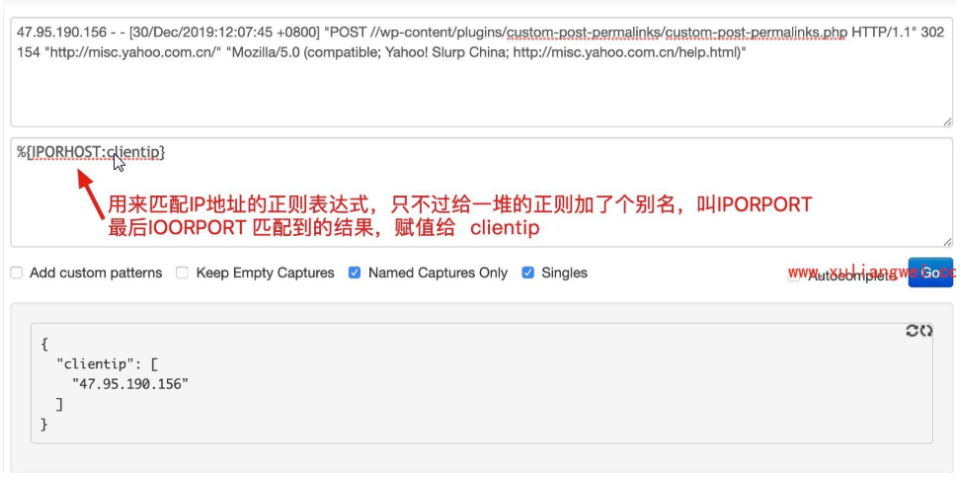
2.grok如何解决该问题呢? grok其实是带有名字的正则表达式集台。grok 内置J很多pattern可以直接使用。
grok语法生成器: http://grokdebug.herokuapp.com/#grok语法生成器grokdebug.herokuapp.com
%{IPORHOST:clientip} %{NGUSER:ident} %{NGUSER:auth} \[%{HTTPDATE:timestamp}\]
"%{WORD:verb} %{URIPATHPARAM: request} HTTP/%{NUMBER: httpversion}" %{NUMBER:response}
(?:%{NUMBER:bytes}I-) (?:"(?:%{URI:referrer}|-)" |%{QS:referrer})
%{QS:agent} %{QS:xforwardedfor} %{IPORHOST:host} %{BASE10NUM:request_duration}
3.grok语法示意图
4.grok示例、使用grok pattern将Nginx日志格式化为json格式
#grok语法生成器grokdebug.herokuapp.com
filter {
    grok {
        match => { "message" => "%{COMBINEDAPACHELOG}" }
    }
4.2 Date插件
date插件:将日期字符串解析为日志类型。然后替换@timestamp字段或指定的其他字段●match 类型为数组,用于指定日期匹配的格式,可以以此指定多种日期格式●target类型为字符串,用于指定赋值的字段名,默认是@timestamp●timezone 类型为字符串,用于指定时区域1.date示例,将nginx请求中的timestamp日志进行解析
#创建插件input_http_output_console.conf
[root@logstash-node1 conf.d]# vim input_http_output_console.conf
input {
    http {
        port => 7474
    }
}

filter {
    grok {
        match => { "message" => "%{COMBINEDAPACHELOG}" }
    }

    date {
        match => ["timestamp", "dd/MMM/yyyy:HH:mm:ss Z"]
        target => "@timestamp"
        timezone => "Asia/Shanghai"
    }
}

output {
    stdout {
        codec => rubydebug
    }
}
[root@logstash-node1 conf.d]# /usr/share/logstash/bin/logstash -f input_http_output_console.conf -r
4.3 Geoip插件
input {
    beats {
        port => 5000  # 监听的端口号,可以根据需要修改
    }
}

filter {
    grok {
        match => { "message" => "%{COMBINEDAPACHELOG}" }
    }
    date {
        match => ["timestamp", "dd/MMM/yyyy:HH:mm:ss Z"]
        target => "@timestamp"
        timezone => "Asia/Shanghai"
    }

    geoip {
        source => "[source][address]"
        target => geooo
        database => "/usr/local/logstash/vendor/bundle/jruby/3.1.0/gems/logstash-filter-geoip-7.3.1-java/vendor/GeoLite2-City.mmdb"
    }
}

output {

  file {
    path => "/opt/nginx_processed.log"  # 目标文件路径
    codec => line { format => "%{message} %{@timestamp} %{[geooo][ip]} %{[geooo][geo][country_name]}" }  # 自定义输出格式(可选)

    # 其他参数:
    # flush_interval => 5    # 缓冲刷新间隔(秒)
    # gzip => true           # 启用GZIP压缩(需文件轮转配合)
  }
    stdout {
        codec => rubydebug
    }
}
4.4 mutate插件
mutate_主要是对字段进行、类型转换、删除、替换、更新等操作_ ●remove_ field 删除字段 ●split字符串切割 ●add_ field添加字段 ●convert 类型转换 ●gsub字符串替换 ●rename字段重命名 mutate插件是logstash另一个非常重要的插件,它提供了丰富的基础类型数据处理能力,包括重命名、删除、替换、修改日志事件中的字段。我们这里举几个常用的mutate插件:字段类型转换功能covert、正则表达式替换字段功能gsub、分隔符分隔字符串为数值功能split、重命名字段功能rename、删除字段功能remove_field。
1.mutate删除无用字段比如: headers、message、 agent
filter{
    grok {
        match => {
            "message" => "%{IP:ip}"
        }
        remove_field => ["message"]
    }
    geoip {
        source => "ip"
    }
}
2.分隔符分隔字符串为数组---->字符分割
split可以通过指定的分隔符分隔字段中的字符串为数组。
filter{
    mutate {
        split => { "message" =>  "|" }
    }
}
3.添加字段add_field。
添加字段多用于split分隔中,主要是对split分隔后的字段中指定格式输出。
filter{
    mutate {
        add_field => {
            "userID" => "%{[message][0]}"
        }
        remove_field => [ "message","headers","timestamp" ]
    }
}
4.mutate中的convert类型转焕。支持转换 integer、float、string、和boolean
添加字段多用于split分隔中,主要是对split分隔后的字段中指定格式输出。
filter{
    mutate {
        add_field => {
            "userID" => "%{[message][0]}"
            "Action" => "%{[message][1]}"
            "Date"   => "%{[message][2]}"
        }
        remove_field => ["message","headers"]
        convert => {
            "userID" => "integer"
            "Action" => "string"
            "Date"   => "string"
        }
    }
}
五、 Logstash Output插件
负责将Logstash Event输出,常见的插件如下:
●stdout
●filehe
●elasticsearch
output {
    stdout {
        codec => rubydebug
    }

    elasticsearch {
        hosts => ["10.0.0.161:9200","10.0.0.162:9200","10.0.0.163:9200"]
        index => "app-%{+YYYY.MM.dd}"     #索引名称
        template_overwrite => true
    }
}
上述案例代码实现下效果展示
[root@logstash-node1 conf.d]# cat input_http_filter_grok_output_console.conf

input {
    http {
        port => 7474
    }
}

filter {
    grok {
        match => { "message" => "%{COMBINEDAPACHELOG}" }
    }
    geoip {
        source => "clientip"
    }

    date {
        match => ["timestamp", "dd/MMM/yyyy:HH:mm:ss Z"]
        target => "@timestamp"
        timezone => "Asia/Shanghai"
    }

    useragent {
        source => "agent"
        target => "agent"
    }

    mutate {
        remove_field => [ "message","headers","timestamp" ]
    }

    mutate {
        split => { "message" =>  "|" }
    }

    mutate {
        add_field => {
            "userID" => "%{[message][0]}"
            "Action" => "%{[message][1]}"
            "Date"   => "%{[message][2]}"
        }
        remove_field => ["message","headers"]
        convert => {
                    "userID" => "integer"
                    "Action" => "string"
                    "Date"   => "string"
        }
    }
}

output {
    stdout {
        codec => rubydebug
    }
    elasticsearch {
        hosts => ["10.0.0.161:9200","10.0.0.162:9200","10.0.0.163:9200"]
        index => "app-%{+YYYY.MM.dd}"     #索引名称
        template_overwrite => true
    }
}
六、日志收集概述
●1.将Nginx普通日志转换为json
●2.将Nginx 日志的时间格式进行格式化输出
●3.将Nginx 日志的来源IP进行地域分析
●4.将Nginx 日志的user -agent字段进行分析
●5.将Nginx 日志的bytes修改为整数
●6.移除没有用的字段, message、 headers
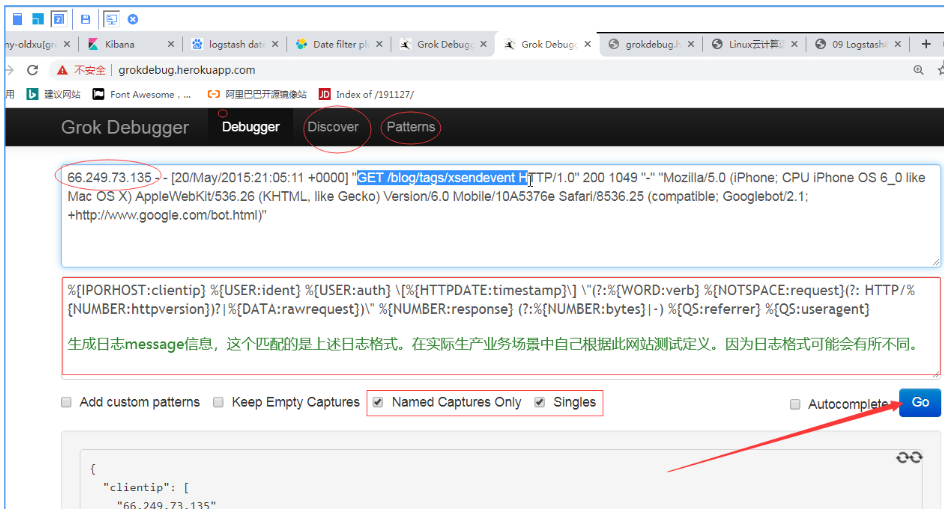
#日志格式
66.249.73.135 - - [20/May/2015:21:05:11 +0000] "GET /blog/tags/xsendevent HTTP/1.1" 200 10049 "-" "Mozilla/5.0 (iPhone; CPU iPhone OS 6_0 like Mac OS X) AppleWebKit/536.26 (KHTML, like Gecko) Version/6.0 Mobile/10A5376e Safari/8536.25 (compatible; Googlebot/2.1; +http://www.google.com/bot.html)"
1.在grok上面生成message。
1.编写fiebeat
#依赖环境filebeat
[root@web01 ~]# cd /etc/filebeat/
[root@web01 filebeat]# /var/log/nginx/access.log
[root@web01 filebeat]# vim filebeat.yml
[root@web01 filebeat]# cat filebeat.yml
filebeat.inputs:
- type: log
  enabled: true
  paths:
    - /var/log/nginx/access.log
  tags: ["nginx-access"]

- type: log
  enabled: true
  path:
    - /var/log/nginx/error.log
  tags: ["nginx-error"]

output.logstash:
  hosts: ["10.0.0.151:5044"]

#将日志写入/var/log/nginx/access.log
[root@web01 filebeat]# cat /var/log/nginx/access.log
66.249.73.135 - - [20/May/2015:21:05:11 +0000] "GET /blog/tags/xsendevent HTTP/1.1" 200 10049 "-" "Mozilla/5.0 (iPhone; CPU iPhone OS 6_0 like Mac OS X) AppleWebKit/536.26 (KHTML, like Gecko) Version/6.0 Mobile/10A5376e Safari/8536.25 (compatible; Googlebot/2.1; +http://www.google.com/bot.html)"
[root@web01 filebeat]# systemctl restart filebeat
编写logstash文件
  [root@logstash-node1 conf.d]# vim input_filebeat_output_es.conf
[root@logstash-node1 conf.d]# cat input_filebeat_output_es.conf
input {
    beats {
        port => 5044
    }
}

filter {

if "nginx-access" in [tags][0] {
    grok {
        match => { "message" => "%{IPORHOST:clientip} %{USER:ident} %{USER:auth} \[%{HTTPDATE:timestamp}\] \"(?:%{WORD:verb} %{NOTSPACE:request}(?: HTTP/%{NUMBER:httpversion})?|%{DATA:rawrequest})\" %{NUMBER:response} (?:%{NUMBER:bytes}|-) %{QS:referrer} %{QS:useragent}" }
    }

    date {
        match => ["timestamp", "dd/MMM/yyyy:HH:mm:ss Z"]
        target => "@timestamp"
        timezone => "Asia/Shanghai"
    }

    geoip {
        source => "clientip"
    }

    useragent {
        source => "useragent"
        target => "useragent"
    }

    mutate {
        rename => ["%{[host][name]}" , "hostname" ]
        convert => [ "bytes", "integer" ]
        remove_field => [ "message", "agent" , "input","ecs" ]
        add_field => { "target_index" => "logstash-nginx-access-%{+YYYY.MM.dd}" }
    }
}  else if "nginx-error" in [tags][0] {
    mutate {
        add_field => { "target_index" => "logstash-nginx-error-%{+YYYY.MM.dd}" }
    }
   }

}

output {
    elasticsearch {
        hosts => ["10.0.0.161:9200","10.0.0.162:9200","10.0.0.163:9200"]
        index => "%{[target_index]}"
    }
}


[root@logstash-node1 conf.d]#  /usr/share/logstash/bin/logstash -f /etc/logstash/conf.d/input_filebeat_output_es.conf -r
#另开一个窗口查看端口
[root@logstash-node1 conf.d]# netstat -lntp
tcp6       0      0 :::5044            :::*          LISTEN      10500/java

#创造点错误日志--->web01
[root@web01 filebeat]# curl 10.0.0.7/sdasfdsafadsfsdaf
进入浏览器查看并分析


1. MySQL慢日志收集介绍
1.什么是Mysql慢查询日志?
当SQL语句执行时间超过所设定的阈值时,便会记录到指定的日志文件中,所记录内容称之为慢查询日志。
2.为什么要收集Mysql慢查询日志?
数据库在运行期间,可能会存在SQL语句查询过慢,那我们如何快速定位、分析哪些SQL语旬需要优化处理,又是哪些SQL语旬给业务系统造成影响呢?当我们进行统-的收集分析, SQL语句执行的时间,对应语句的具体写法,一目了然.
3.如何收集Mysq|慢查询日志?
1.安装MySQL2.开启MySQL慢查询日志记录3.使用filebeat收集本地慢查询日志路径
环境:10.0.0.7   2G  1G
[root@web01 ~]# yum install mariadb mariadb-server -y
#重启mariadb
[root@db01 ~]# vim /etc/my.cnf
[mysqld]
...
slow_query_log=ON
slow_query_log_file=/var/log/mariadb/slow.log
long_query_time=3
...

[root@db01 ~]# systemctl restart mariadb
[root@web01 ~]# ls /var/log/mariadb
mariadb.log  slow.log
[root@web01 ~]# mysql -uroot -poldxu.com
Welcome to the MariaDB monitor.  Commands end with ; or \g.
Your MariaDB connection id is 8
Server version: 5.5.64-MariaDB MariaDB Server

Copyright (c) 2000, 2018, Oracle, MariaDB Corporation Ab and others.

Type 'help;' or '\h' for help. Type '\c' to clear the current input statement.
#模拟慢日志
MariaDB [(none)]> select sleep(1) user,host from mysql.user;
+------+-----------+
| user | host      |
+------+-----------+
|    0 | %         |
|    0 | %         |
|    0 | %         |
|    0 | %         |
|    0 | 127.0.0.1 |
|    0 | ::1       |
|    0 | localhost |
|    0 | localhost |
|    0 | localhost |
|    0 | web01     |
|    0 | web01     |
+------+-----------+
11 rows in set (11.48 sec)

Your MariaDB connection id is 8
MariaDB [(none)]> select sleep(1) user,host from mysql.user;
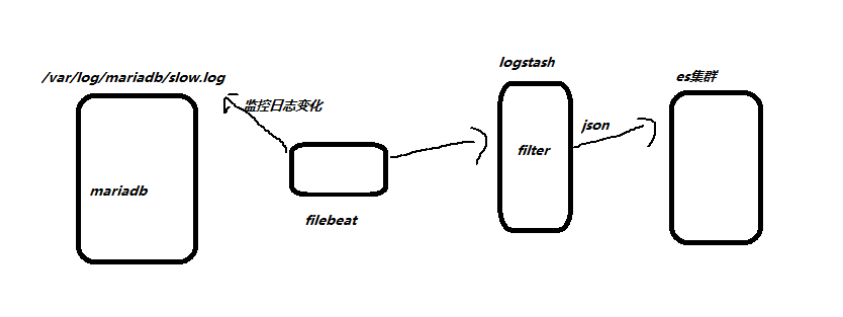
2. 日志格式转换
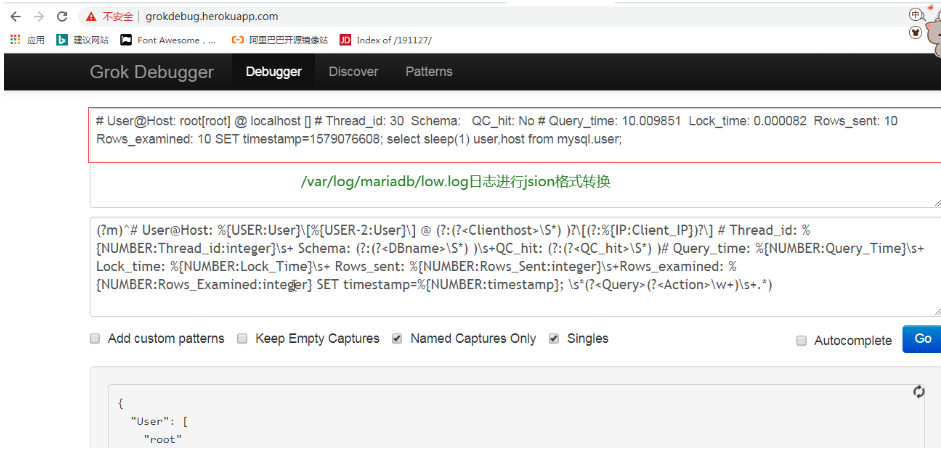

#编写filebeat.yml文件
[root@web01 filebeat]# cat filebeat.yml
filebeat.inputs:
- type: log
  enabled: true
  paths:
    - /var/log/mariadb/slow.log
  exclude_lines: ['^\# Time']
  multiline.pattern: '^\# User'
  multiline.negate: true
  multiline.match: after
  multiline.max_lines: 10000
  tags: ["mysql-slow"]

output.logstash:
  hosts: ["10.0.0.151:5044"]
编写logstash文件
  [root@logstash-node1 conf.d]# cat input_filebeat_mysql_output_es.conf
input {
    beats {
        port => 5044
    }
}

filter {
    mutate {
        gsub => ["message","\n"," "]
    }

    date {
        match => ["timestamp","UNIX", "YYYY-MM-dd HH:mm:ss"]
        target => "@timestamp"
        timezone => "Asia/Shanghai"
    }
    mutate {
        remove_field => ["message","input","timestamp","agent","ecs","log"]
        convert => ["Lock_Time","float"]
        convert => ["Query_Time","float"]
        add_field => { "target_index" => "logstash-mysql-slow-%{+YYYY.MM.dd}" }
    }
}

output {
    elasticsearch {
        hosts => ["10.0.0.161:9200"]
        index => "%{[target_index]}"
    }
    stdout {
        codec => "rubydebug"
    }
}

[root@logstash-node1 conf.d]# /usr/share/logstash/bin/logstash -f /etc/logstash/conf.d/input_filebeat_mysql_output_es.conf -r


#进行日志刷新,启动filebeat
[root@web01 filebeat]# mysql -uroot -poldxu.com
Welcome to the MariaDB monitor.  Commands end with ; or \g.
Your MariaDB connection id is 17
Server version: 5.5.64-MariaDB MariaDB Server

Copyright (c) 2000, 2018, Oracle, MariaDB Corporation Ab and others.

Type 'help;' or '\h' for help. Type '\c' to clear the current input statement.

MariaDB [(none)]>  select sleep(1) user,host from mysql.user;
+------+-----------+
| user | host      |
+------+-----------+
|    0 | %         |
|    0 | %         |
|    0 | %         |
|    0 | %         |
|    0 | 127.0.0.1 |
|    0 | ::1       |
|    0 | localhost |
|    0 | localhost |
|    0 | localhost |
|    0 | web01     |
|    0 | web01     |
+------+-----------+
11 rows in set (11.01 sec)

MariaDB [(none)]> Bye
[root@web01 filebeat]# systemctl restart filebeat
服务器输出窗口如下图示

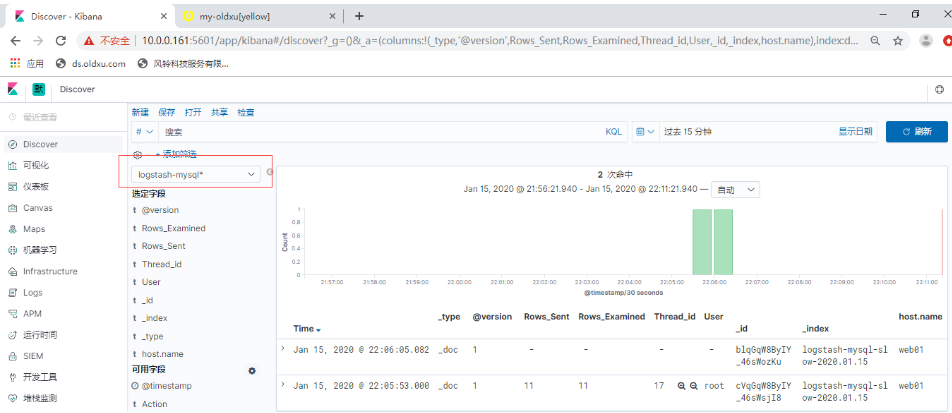
慢日志检测
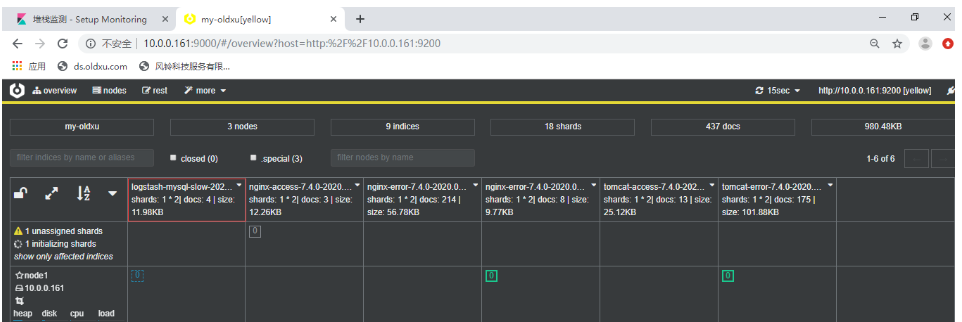
创建索引,依次按步骤执行结果如下
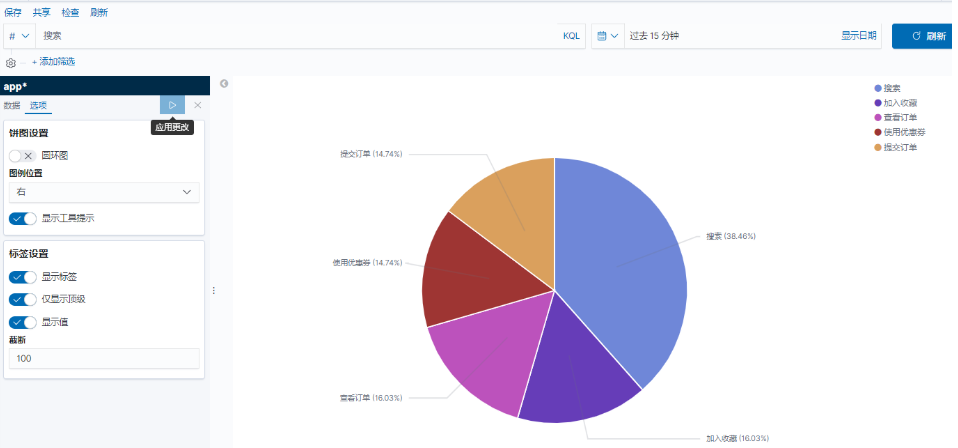
3. logstash手机app日志
  #上传app-dashboard-1.0-SNAPSHOT 到服务器web01模拟日志
[root@web01 log]# java -jar app-dashboard-1.0-SNAPSHOT.jar &>/var/log/app.log
[root@web01 ~]# tail -f /var/log/app.log
[INFO] 2020-01-15 22:21:03 [cn.oldxu.dashboard.Main] - DAU|2635|领取优惠券|2020-01-15 18:09:02
[INFO] 2020-01-15 22:21:08 [cn.oldxu.dashboard.Main] - DAU|3232|领取优惠券|2020-01-15 15:21:06
[INFO] 2020-01-15 22:21:11 [cn.oldxu.dashboard.Main] - DAU|8655|使用优惠券|2020-01-15 10:05:10
[INFO] 2020-01-15 22:21:15 [cn.oldxu.dashboard.Main] - DAU|498|评论商品|2020-01-15 18:15:04
[INFO] 2020-01-15 22:21:18 [cn.oldxu.dashboard.Main] - DAU|1603|加入购物车|2020-01-15 16:13:03
[INFO] 2020-01-15 22:21:18 [cn.oldxu.dashboard.Main] - DAU|7085|提交订单|2020-01-15 15:10:06
[INFO] 2020-01-15 22:21:21 [cn.oldxu.dashboard.Main] - DAU|5576|搜索|2020-01-15 09:06:06
[INFO] 2020-01-15 22:21:23 [cn.oldxu.dashboard.Main] - DAU|6309|搜索|2020-01-15 11:20:16
4. 编写filebeat.yml配置文件
  [root@web01 filebeat]# cat filebeat.yml
filebeat.inputs:
- type: log
  enabled: true
  paths:
    - /var/log/app.log

  hosts: ["10.0.0.151:5044"]

#思考:如果有两台机器都有日志,filebeat则再另外一台机器也要配置filebeat.yml
编写logstash文件
  [root@logstash-node1 conf.d]# cat input_filebeat_app_output_es.conf
input {
    beats {
        port => 5044
    }
}

filter {
    mutate {
        split => {"message" => "|"}
        add_field => {
            "UserID" => "%{[message][1]}"
            "Action" => "%{[message][2]}"
            "Date" => "%{[message][3]}"
        }

        convert => {
            "UserID" => "integer"
             "Action" => "string"
             "Date"   => "string"
         }
    }

    #2020-01-15 17:04:15
    date {
        match => ["Date","yyyy-MM-dd HH:mm:ss"]
        target => "@timestamp"
        timezone => "Asia/Chongqing"
    }

    mutate {
    #remove_field => ["message","Date"]
    add_field => { "target_index" => "logstash-app-%{+YYYY.MM.dd}" }
    }
}

output {
    elasticsearch {
        hosts => ["10.0.0.161:9200"]
        index => "%{[target_index]}"
        template_overwrite => true
    }
    stdout {
        codec => "rubydebug"
    }
}

[root@logstash-node1 conf.d]# /usr/share/logstash/bin/logstash -f /etc/logstash/conf.d/input_filebeat_app_output_es.conf -r
[root@web01 filebeat]# systemctl restart filebeat